I was excited to read the recent paper by Callaghan et al. in PNAS entitled “Global abundance estimates for 9700 bird species.” The authors undertake the impressive and daunting task of estimating the global abundances of nearly all the world’s bird species. This information has obvious and important implications for understanding a wide array of question in macroecology and conservation biology.
I have no issues with the underlying analysis itself, which I think was carefully thought out and executed. However, I was very surprised to see the sizes of the reported confidence intervals (CIs) around the authors’ point estimates for global bird abundances. Below is a figure I made showing the point estimates of population size for each of the 9700 species analyzed, as well as the 95% confidence intervals surrounding them. Species are ranked from highest to lowest estimated abundance, the x-axis in the left panel is on a log scale. These data come straight from the supplemental information provided in the original paper.
I have no issues with the underlying analysis itself, which I think was carefully thought out and executed. However, I was very surprised to see the sizes of the reported confidence intervals (CIs) around the authors’ point estimates for global bird abundances. Below is a figure I made showing the point estimates of population size for each of the 9700 species analyzed, as well as the 95% confidence intervals surrounding them. Species are ranked from highest to lowest estimated abundance, the x-axis in the left panel is on a log scale. These data come straight from the supplemental information provided in the original paper.
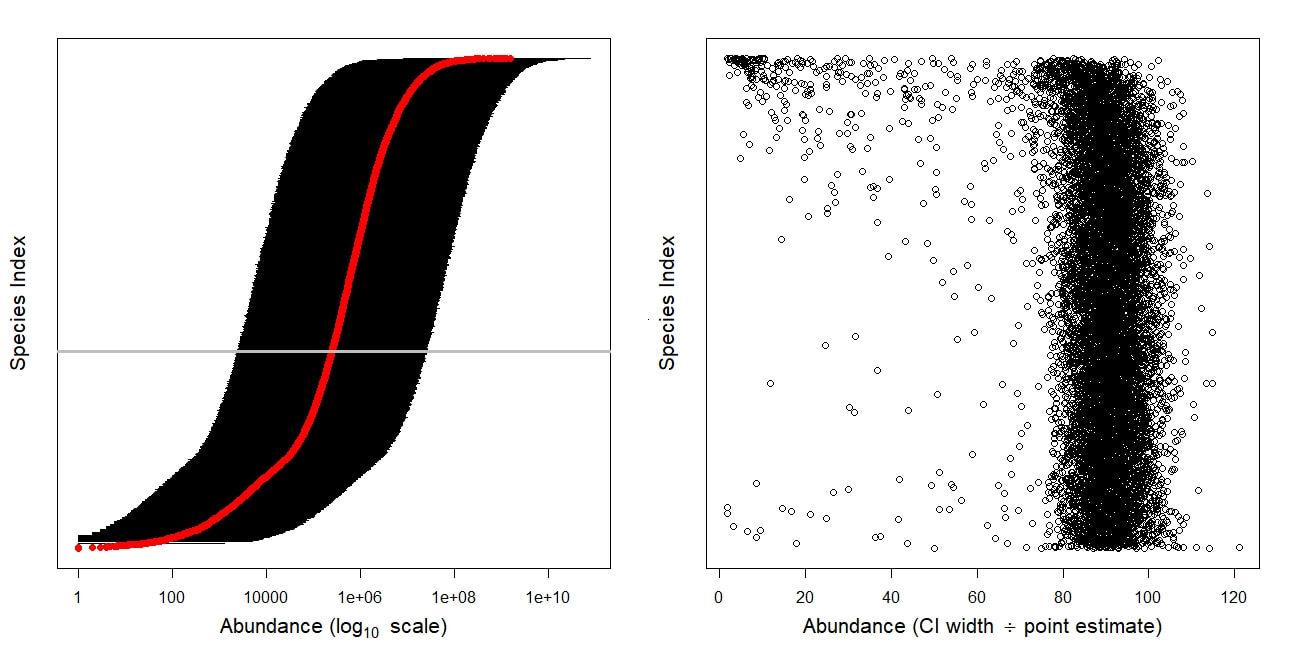
For 9,472 species (98% of all species considered), the CIs span more than three orders of magnitude, and for 8,889 species (91.6%), the CIs are more than 80 times larger than the point estimate itself. As a result, interpreting these abundance estimates requires making statements like: “We are 95% confident that the global abundance of Larus hyperboreus lies somewhere between 11 million and 78 billion.” While I think it is great that the authors focused so much attention on accounting for uncertainty in their models, I’m also unsure what the utility of their resulting estimates are given these extremely large CIs.
Another curious situation arises from these data. If you look again at the left figure above you can see that 6780 species (~70% of all species) have global abundance estimates whose CIs overlap with the CI of the fifth most abundant species. The horizontal gray line represents this break point. This implies that even species predicted to be relatively uncommon (i.e., species above but close to the horizontal gray line) actually have a non-trivial chance of being one of the most abundant species on the planet!
And it’s not as if there’s no precedence for conducting similar kinds of global estimates of difficult to measure properties like species abundance. Stanton et al. (2019) estimated population sizes for all North American bird species. They showed that 76% of the species analyzed have confidence intervals that are < 2/3 the size of the point estimate. Similarly, Crowther et al. (2015) estimated the total number of trees on planet Earth and report a CI that is ~1/15 that of the point estimate (i.e., 3.04 0.096 trillion individual trees). The success of these studies in comparison to the results from Callaghan et al. is likely due to better quality training data available for these other studies. Abundance estimates for North American birds utilizes high-quality monitoring programs like the USGS Breeding Bird Survey, and Crowther et al. (2015) used hundreds of thousands of high-quality abundance samples in their predictive model. As a result, comparisons to these other studies makes me highly skeptical as to whether there exist enough data on global bird abundances to carry out the analysis that is presented. I think with the continued monitoring of global bird populations via citizen science efforts like eBird and other large-scale monitoring programs this kind of question could be more accurately approached in the future. I’m just not convinced we’re there yet.
A more general thought that I had after reading this paper is whether simply accounting for uncertainty in statistical models is really enough. Obviously, this is important to do, and Bayesian hierarchical models like the ones used by Callaghan make the process of error propagation relatively straightforward. But at what point does the amount of uncertainty become so great that inferences become meaningless? I would tend to argue that this is happening in the present case. In the end, I think this work is a good springboard for future efforts, and, like I mentioned above, the modelling approach seems sound and could be used for future research applications. But I do hope readers of this paper notice the limitations of these data and take appropriate caution when using them for future analyses.
 RSS Feed
